Objective 1
To be able to explain population trends and patterns in births (e.g. Crude Birth Rate)

|
What is the Population of the world today? Use the website link to find out information about the total size of the world population and the factors that make it increase and decrease.
| ||||||
Population Density and Distribution. Where do all of the people in the world live? why do we not all live in the same place? What determines where we live? To examine these questions we are going to work through the population distribution and density worksheet below.
|
|
| ||||||
|
Practise: Just to familiarise yourselves with the type of question you will see for population distribution or population density, here is an exam question. Please note: This is from an older syllabus paper so will be a little different to the types of questions you will see in your exam, but the skills and information are very similar so it should be good practise!
|
| ||
This video from youtube by NPR.org is a nice simple summary of the numbers discussed in this unit.
Objective 2
To understand the relationship between natural increase and mortality (Crude Death Rate, infant and child mortality rates)
|
The human population remained stable for thousands of years until humans started living longer. But what were the circumstances that made this happen? how did humans start living longer? TO understand this we have to look back in time to understand the roots of human civilisation and the impact they have had on today's population.
|
|
This unit will require you to do some thinking, this will be carried out with some complex brainstorming. The idea of this is that you generate as many ideas as possible. Let's see what we can do!
|
You will also need to know the following keywords. Carrying Capacity, Crude Birth Rate, Crude Death Rate, Natural Increase
|
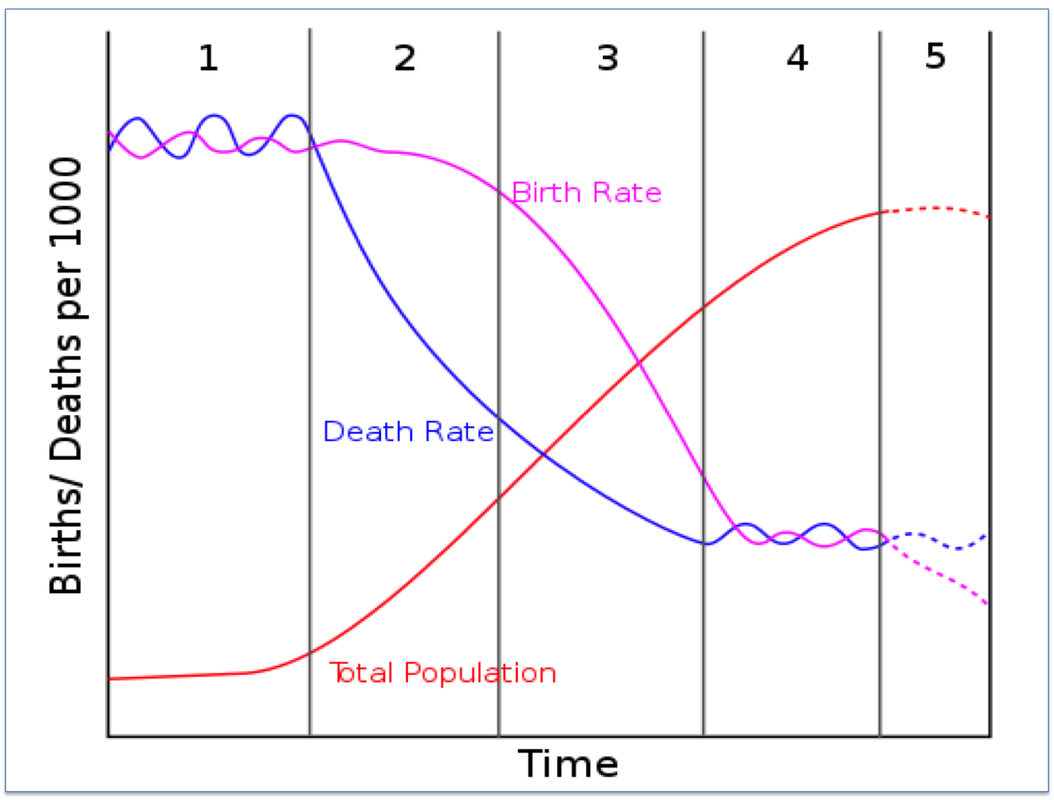
To explore this topic further we will be looking at a model. In Geography we study a few models, they are used to take very complex human or physical processes and try to make them appear more simple by showing the main trends. The model we will be looking at for this section is the Demographic Transition Model. This is a model used to help us understand the relationship between birth rates, death rates and natural increase and how these change over time for different countries. From this understanding we can start to explore how and why these things change in different countries. We do this by learning a Case Study.
|
|
The Demographic Transition Model was developed by looking at the population changes in well developed countries. Therefore the case study we will be using for looking at this will be made by analysing census data from England and Wales (where there are many years worth of data) The worksheet to the left is designed to help you get relevant information from the text book.
|
| ||
Objective 3
To become aware of fertility and life expectancy in contrasting regions of the world
|
What is fertility? It is a term we understand but can we define it in terms of population? How can we measure it? Which countries have a high fertility and low fertility and what could this mean? Is it possible to control the fertility of a country to 'balance' the population? These are all questions that we will be exploring in this section. At the same time we will get an in depth understanding of two countries, one with a high birth rate and one with a low birth rate. You will also get your chance to act as the president of one of these countries and decide the fate of your countries population policy.
|

| |||||||
Objective 4
To develop the skill of analysing population pyramids. Be able to Explain population momentum and
its impact on population projections.
its impact on population projections.
|
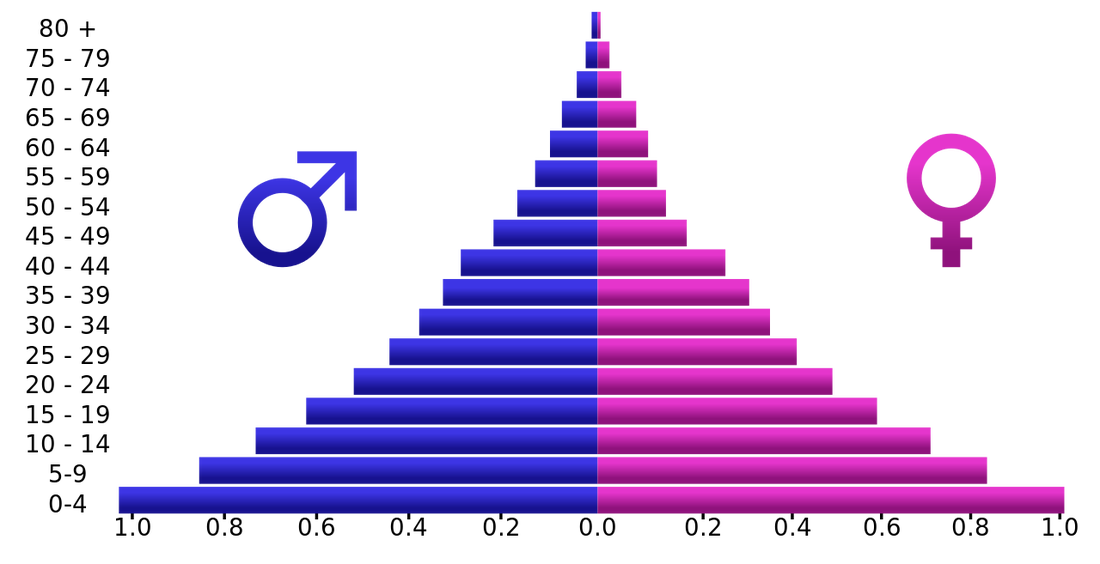
There are different ways to measure populations, but population pyramids help us to break data into different chunks of information. Using population pyramids enables us to see the balance between males and females and the balance between different age groups within a population. Once you become familiar with population pyramids you can start to identify if the country has an ageing or youthful population, if it has a gender imbalance, if the country has been affected by a war or disease, if there has been migration away from the country and even how developed the country is.
|
|
Read pages 17-21 in the text book to help your understanding of population pyramids and download the worksheet to the right to complete the questions. You will also be given an exercise to draw and label your own population pyramids.
|
| ||
