Objective 1
To understand the functioning of a drainage basin as an open system
|
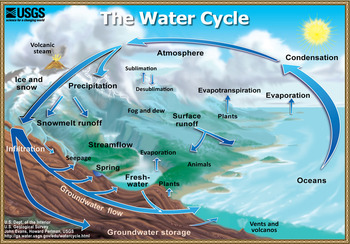
We have looked briefly at the water cycle as a system with a series of inputs, outputs, flows and stores. From a global perspective, this is a closed system but is the same true for an individual river? Do rivers always have the same amount of water flowing through them or does the volume of water (discharge) vary depending on a balance of factors?
|
|
|
Activity 1: You will be given a list of words/terms and your job is to create a system diagram with inputs, outputs, transfers and stores for an individual river system.
|
Activity 2: You are tasked with producing a 1 minute presentation to the class. Using Hong Kong and a contrasting location you need to explain the effect of climate on the balance between the different characteristics of soil moisture in the river system (explained during the lesson)
|
|
Case Study: Water balance in Australia. Download this file and amend it. Your task is to calculate each flow/transfer value as a percentage of the total rainfall figure and add your calculations on to the diagram
| ||
Objective 2
Define stream discharge and examine its relationship to stream flow and channel shape.
After our Thailand expedition and having written up our IA's I think we should be well covered in our knowledge of this area. We need to know what discharge is. We also need to know how discharge, velocity and channel width change as we progress down a river.
Objective 3
Describe the characteristics of a hydrograph. Examine the reasons for spatial and temporal
(short-term and long-term) variations in hydrographs. Examine the role of hydrographs in
forecasting the magnitude, spatial extent and timing of floods.
Hydrographs (sometimes called storm hydrographs or flood hydrographs) show us the discharge of a river over time following a significant rainfall event. They can therefore give us a lot of information about the nature of the river and how it works. In this section we will look at hydrographs with a view to understanding the major characteristic of the graph and what we, as geographers, can find out about a river from them. The powerpoint shown in class is below along with a worksheet we will be using. I have also put a link in to a Geography revision site if you want to go back and check this information.
|
| |||||
|
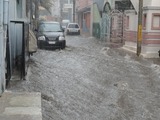
Floods can happen for a number of reasons, some of them natural, some of them influenced by human influences on the landscape. In this section we are going to understand some of the major causes of flood events and determine the extent to which each is human or natural.
|
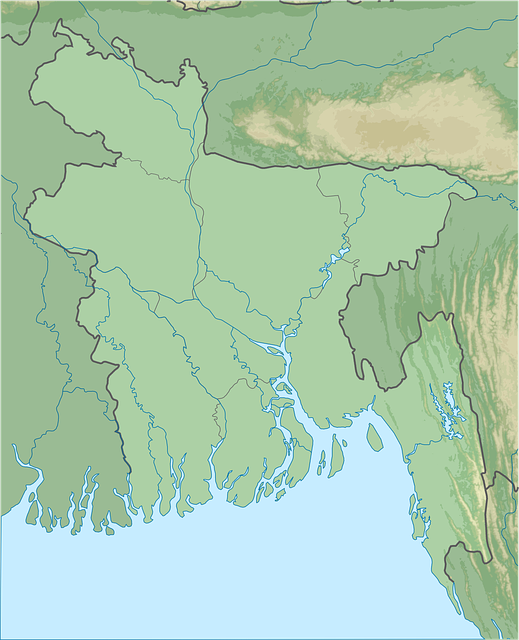
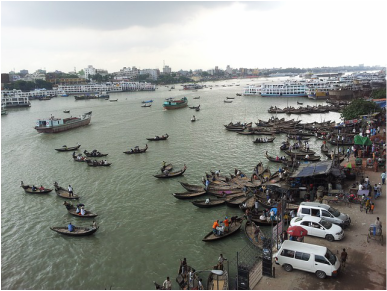
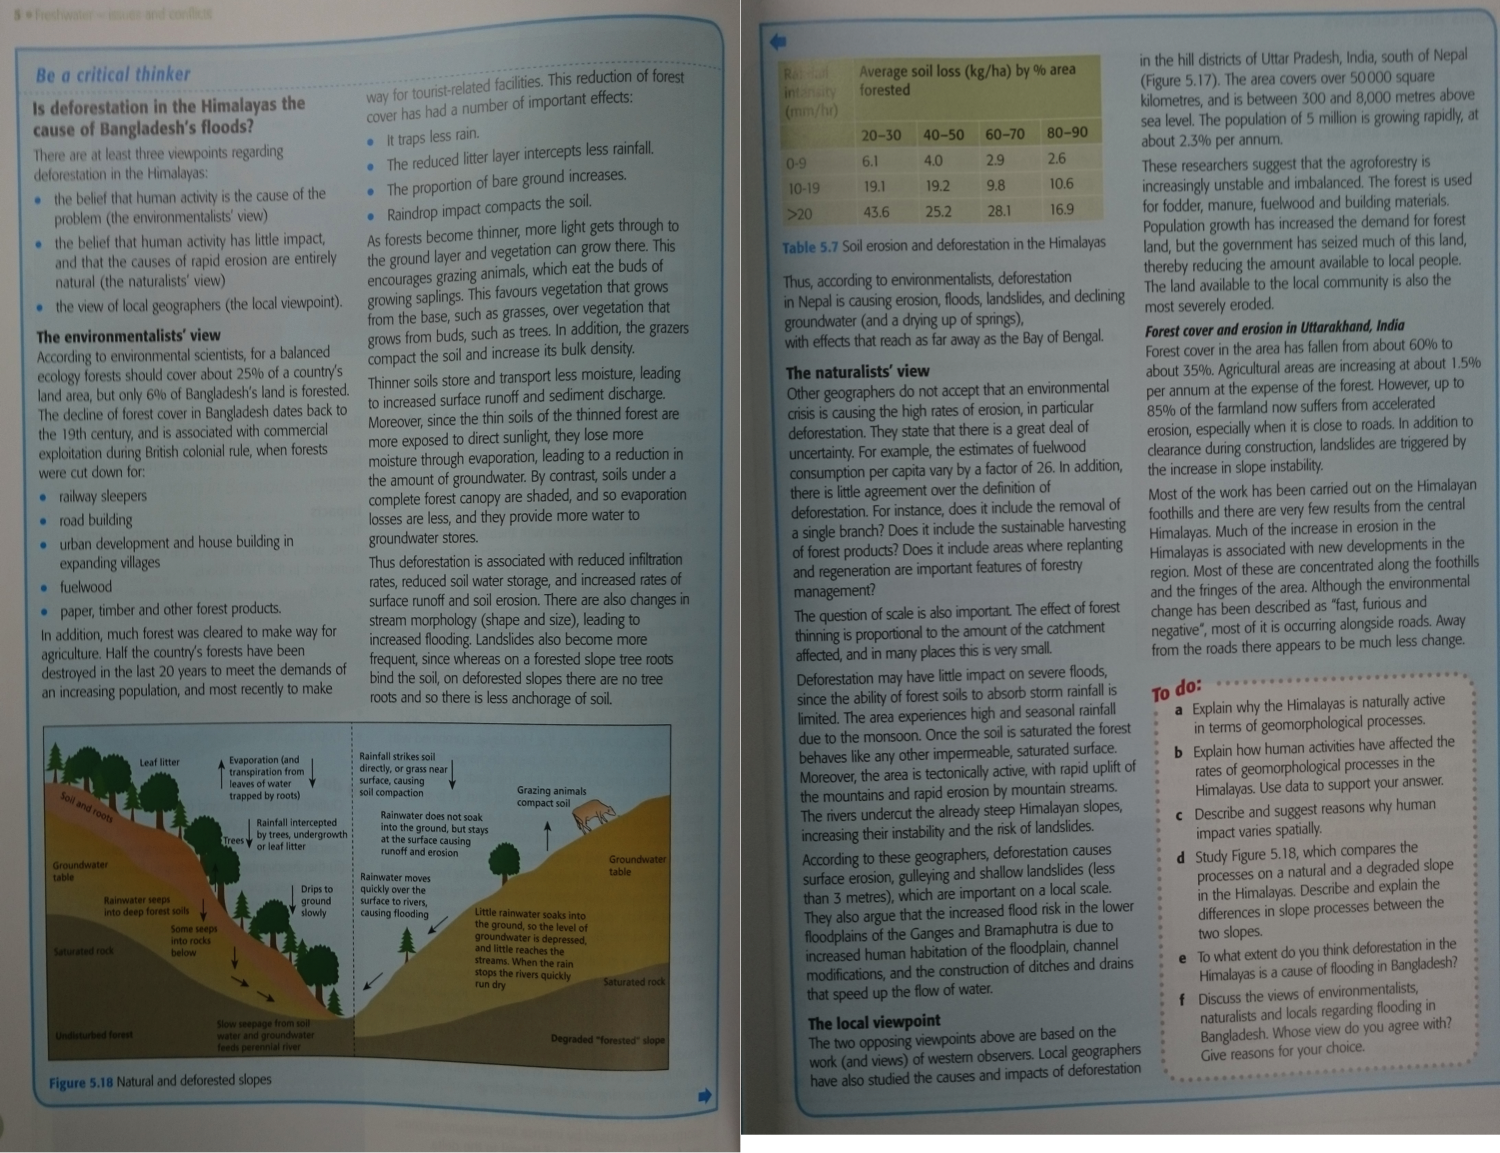
Case Study: Flooding in Bangladesh
|

|
Case Study: Bangladesh. Bangladesh is a low lying country with big rivers flowing through it. It is very susceptible to flooding and suffers a number of impacts every year as a result of flooding. We are going to find out the main reasons why flooding occurs so often in this country and some of the specific impacts that these floods create for the people who live their and the natural environment. You will be given a Paper case study sheet and you need to use the resources below to find the information to complete the case study. Bangladesh case study will supply you with what you need. The file bang_ext gives additional background and thinking stimulus for further understanding of the Bangladesh flood situation.
|
| ||||
Objective 4
To be able to identify landforms and their features along the long profile of a river
|
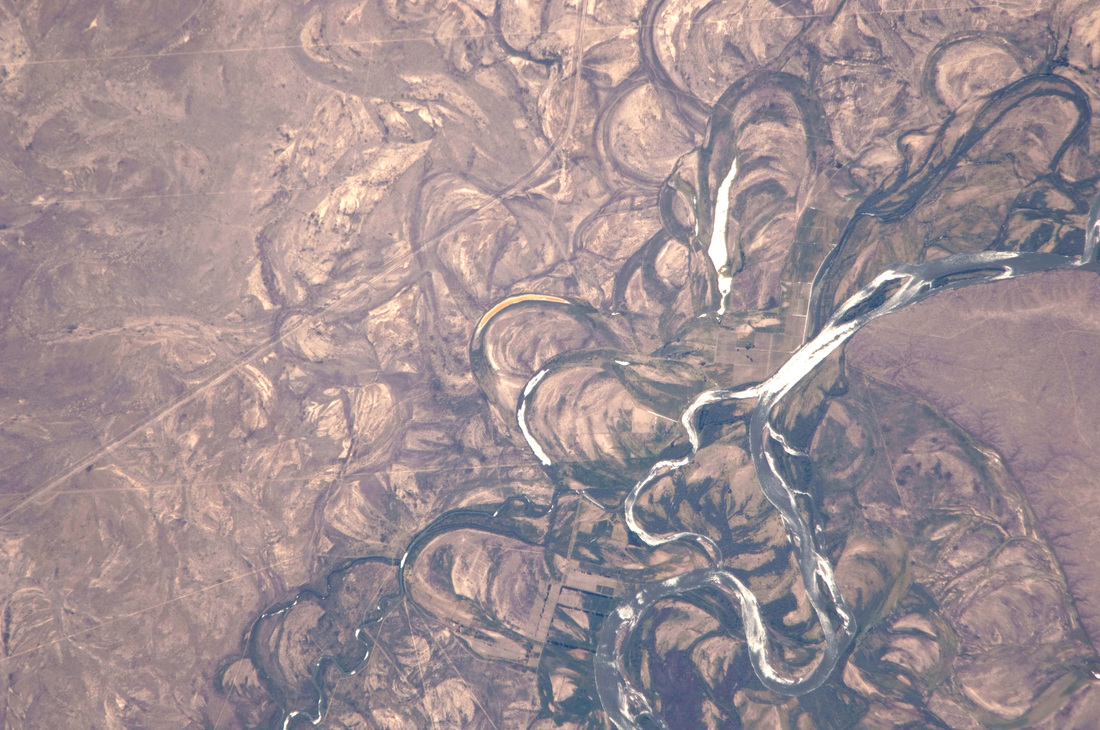
Meanders, waterfalls, ox-bow lakes, V-shaped valleys, interlocking spurs, levees, gorges, floodplains. We know some or all of these terms and can recognise these features but do we know where and how they are formed in a river? In this section we will find out. First off, you need to download this file.
|
| ||
